

Flow Measurement Example
Setting up the test system
Before you can start with your tests, several preparations need to be made.
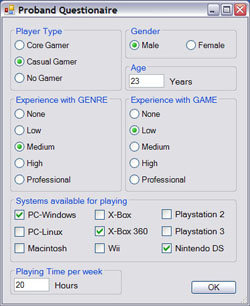
Registering test person data
The observer starts the Game Flow Analysis Tool (GFAT) and starts registering the test person's data.
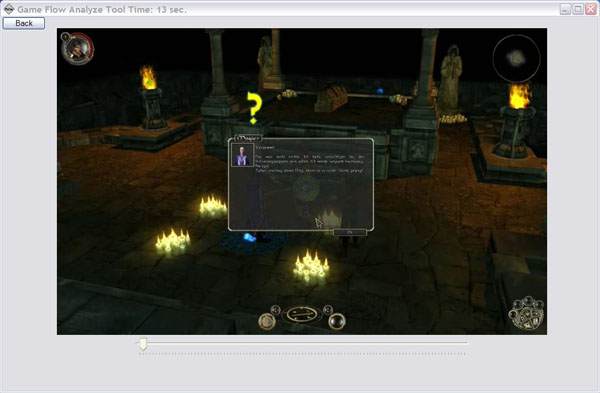
Recording the video
The test person is presented with a task for the game to be played. The observer will start the video recording when the game begins and stop it after the maximum of 60 minutes of game play has been reached. Of course, depending on your goals, you can stop the recording at an earlier stage.
Game play evaluation
Once the recording is complete, the observer imports the video into the GFAT and starts the measurement.
Every minute the test person has to answer four questions:
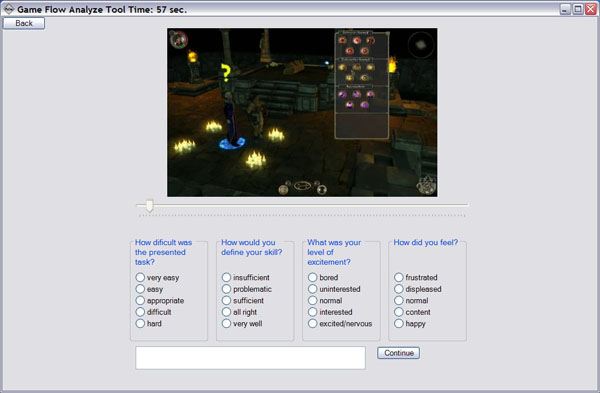
In addition to those four answers test persons can also add a comment on their previous minute of game play and praise or criticize the game experience.
Game play analysis
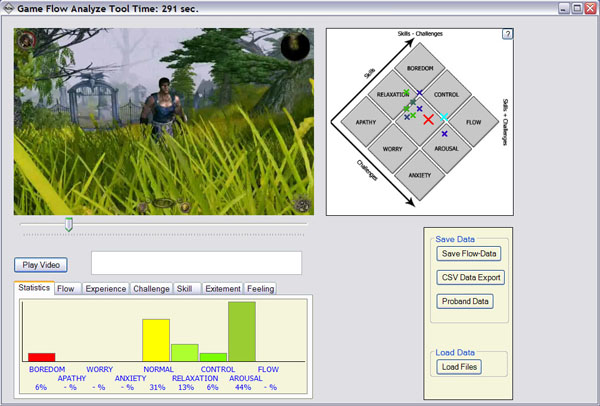
Right after the end of the evaluation (at the end of the video) the results of the analysis are displayed.
Now the observer has another chance to enter the test person's data before saving all data in a CSV or GFAT data file. GFAT files can be opened in the GFAT whereas CSV files are ideal for spreadsheets.
Data Analysis
Flow-View
There are several ways of analyzing the data. The Flow View on the right gives you an overview of the emotional states in an 8 channel flow model. The red cross stands for the average of all ratings. The light blue cross shows the current video position as set by the slider. The other crosses represent individual ratings, with green for the beginning of the video and blue for the end.
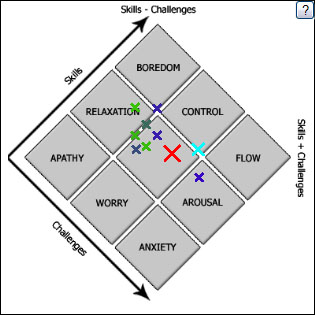
Click on the single ratings in the Flow View to set the game play video to the moment right before the rating. That way you can check what sort of game play experience led to a certain rating. Any additional comment provided by the test person is shown in the comment box.
Data-View
The Data View gives you access to various kinds of information. Here are the separate areas and their interpretations.
Statistics
The statistics show how the individual ratings from the Flow View are spread. Since several crosses often tend to overlap in the Flow View, the statistics will provide you with a quick overview of the exact distribution.
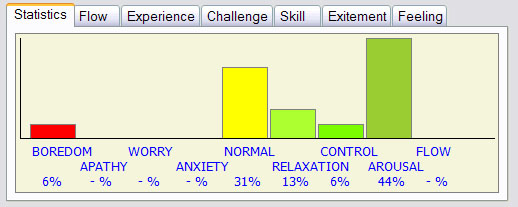
The statistics' interpretation depends on the genre and the developer's and publisher's expectations. For example, players may be expected to experience fear in a horror game, so a scared player would count as a positive result. But if a player gets scared playing a puzzle game like Tetris, that is certainly a negative result.
Flow Analysis
The Flow Display shown here represents the classical approach for measuring flow by comparing skill and challenge. If the rating is the same for both, the player is in a state of flow. If the game is too easy, the red line will be above the black zero line. If the game is too difficult, the red line will stay below the zero line. Ideally, the red line moves up and down - the player adapts to the game's challenges and overcomes more and more difficult problems.
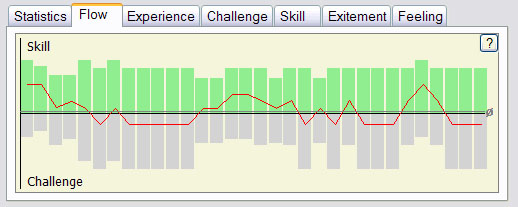
In this example, the test person has a balanced flow curve. The average of all ratings is almost identical with the zero line, so skill and challenge were evenly matched for that particular player. The game switched from "too easy" to "too difficult" regularly, which suggests that the game became more and more challenging and the player had to adapt to that.
Emotion analysis
By expanding the classical flow model, the player's emotions can also be displayed during the game. That way, it is easy to see how players react to challenges.
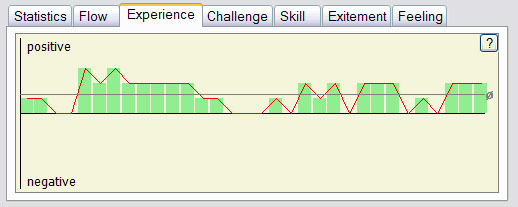
In this example the test person continuously had a positive experience. The average rating is positive. Using flow analysis you can also see that the test person responded positively to the ever-increasing challenge. The player's best emotional results coincide with the game's increasing difficulty (flow scale in the lower area).
Question: Why do we need two analyses? Isn't the flow evaluation good enough?
Flow analysis can be misleading when both skill and challenge are on a relatively weak level. While both figures are in fact identical - so the player was in the flow -, that flow situation is not necessarily a positive one, for if the game is not a challenge, even poorly skilled players will find it uninteresting (apathy area).
Data display
The other displays show the answers to all questions.
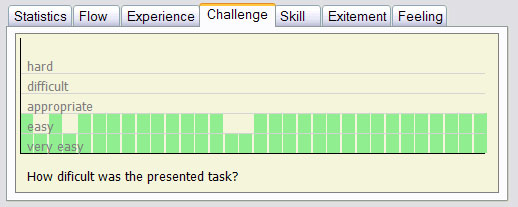
How difficult was the given task?
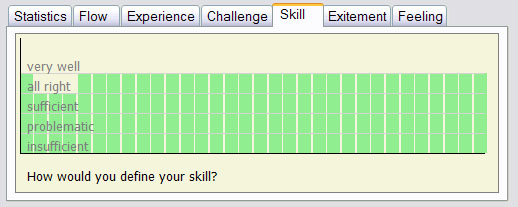
How do you judge your own skills?
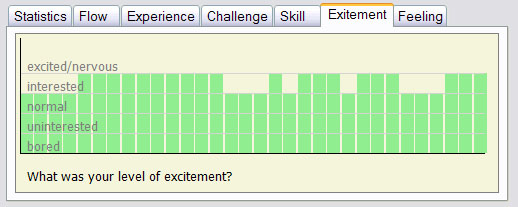
What was your emotional state like?
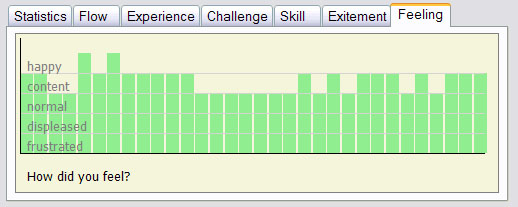
How did you feel?
Saving Data
There are two ways of saving the recorded data:
Saving flow data
Saves the measurement data so it can be imported for analysis later on using the GFAT.
CSV data export
Saves the data in a .csv file. That way the data of several test persons can be compared using spread sheets.
Note
In the demo version only the first five minutes of the video can be rated. The rest of the data is filled up with dummy values, which also affects the statistics.
