Globe Viewer
Globe Viewer is an interactive high-quality 3D representation of the entire Earth's surface. It is not so much a photorealistic representation of the earth, but rather the detailed visualization of its surface structure. Fascinating worlds such as old estuaries or steep underwater mountains, which are completely unknown to most people, can be discovered effortlessly with the Globe Viewer. On the usual flat earth representations such exciting geological details are unfortunately often lost.
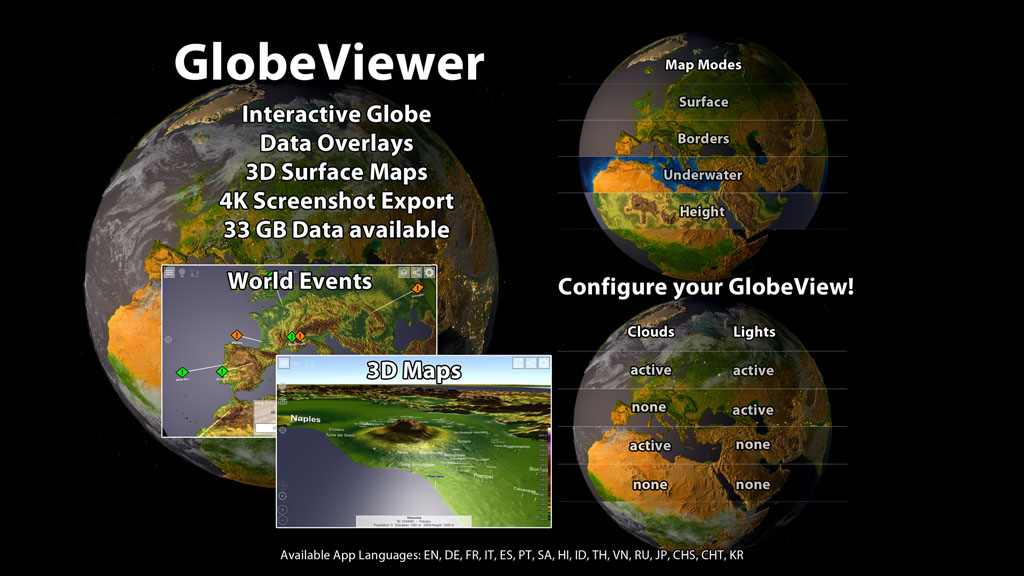
Go on a discovery tour with the Globe Viewer and get to know our blue planet again:
| Free demo version | PRO-Version | |
| Apple iOS and MacOS: | ||
| Google Android: | ||
| Microsoft Windows Store: |
Further development
Most recently, the map data for the app was updated. This was a lengthy process and was completed in 2024. You can find more information about the changes here.
Wallpapers
The wallpapers for your desktop are now available here.
Manual
The manual is available in different languages. Here you can read all about the functions in the app and how to use it:
Global view
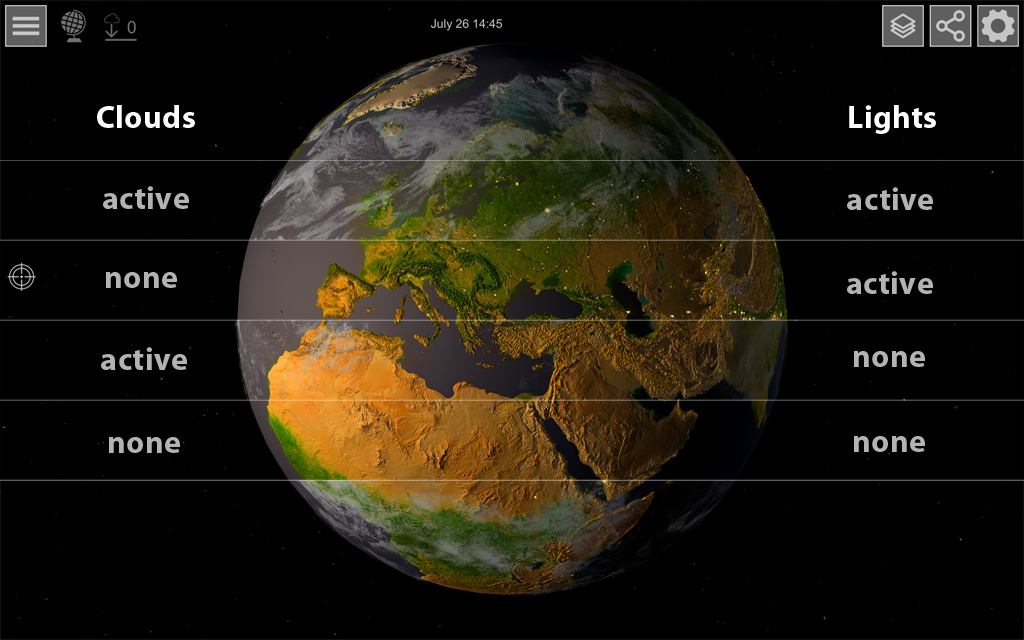
The globe offers different view options. In the settings at the top right you can choose whether to show clouds and night lights on the globe.
Clouds and night lights
Map layers
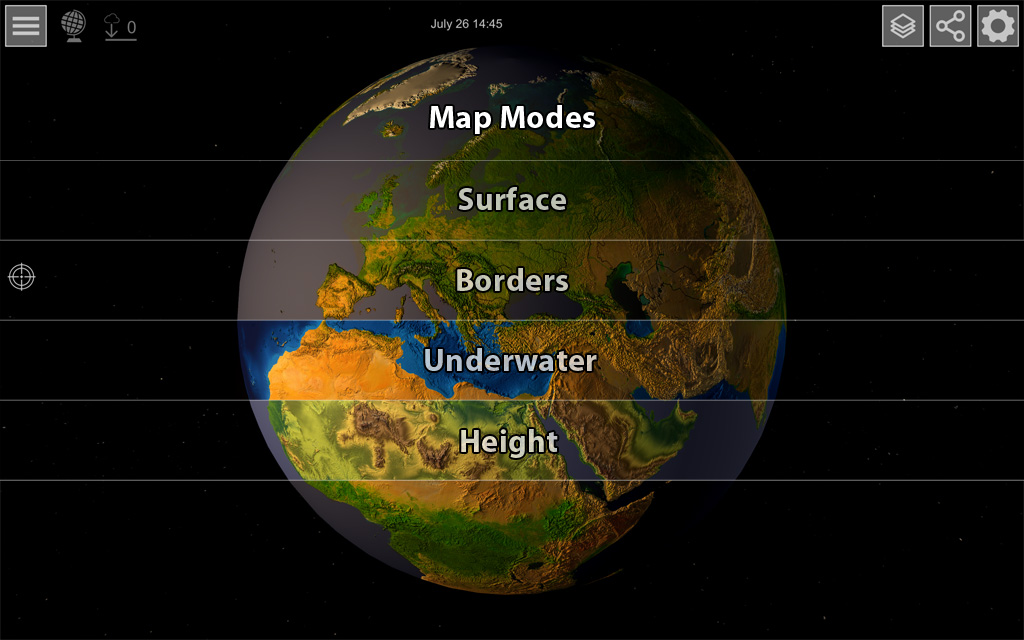
Various map levels are still available. Use the plane icon at the top left to choose between the visible surface, a representation with boundary lines, an underwater representation or show the colored heights of the earth's surface.
Global overlays of states and cities
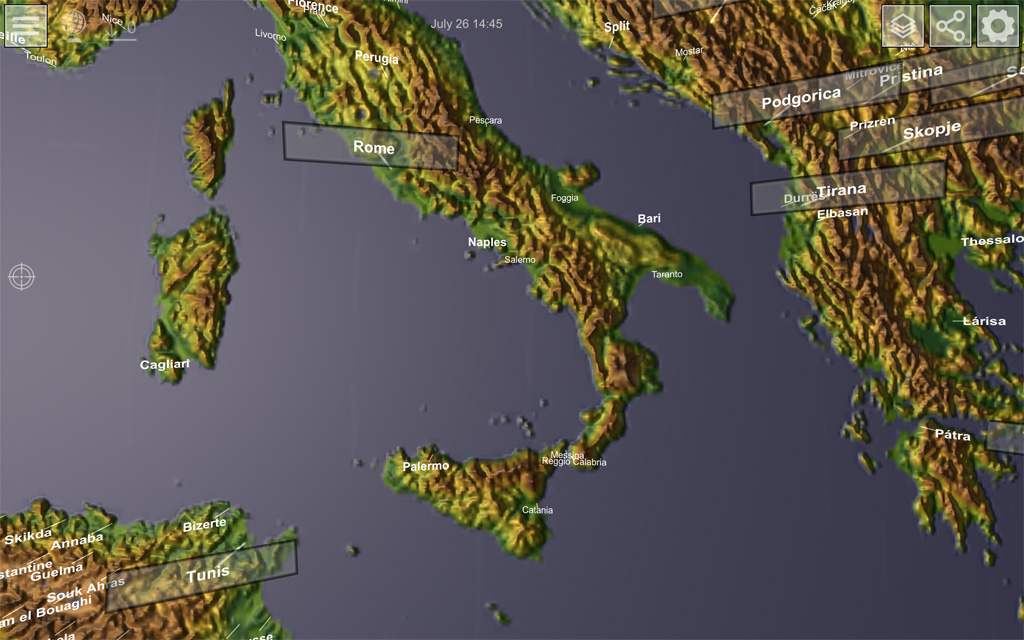
No matter which globe representation you choose, further information can be displayed. Zooming in closer to the globe reveals the names of states and cities. In the options you can set which information should be displayed.
Global overlays of events
If there is a natural event or disaster somewhere in the world, you can represent it on the globe. If necessary, the GDACS system provides more detailed information about the corresponding event.
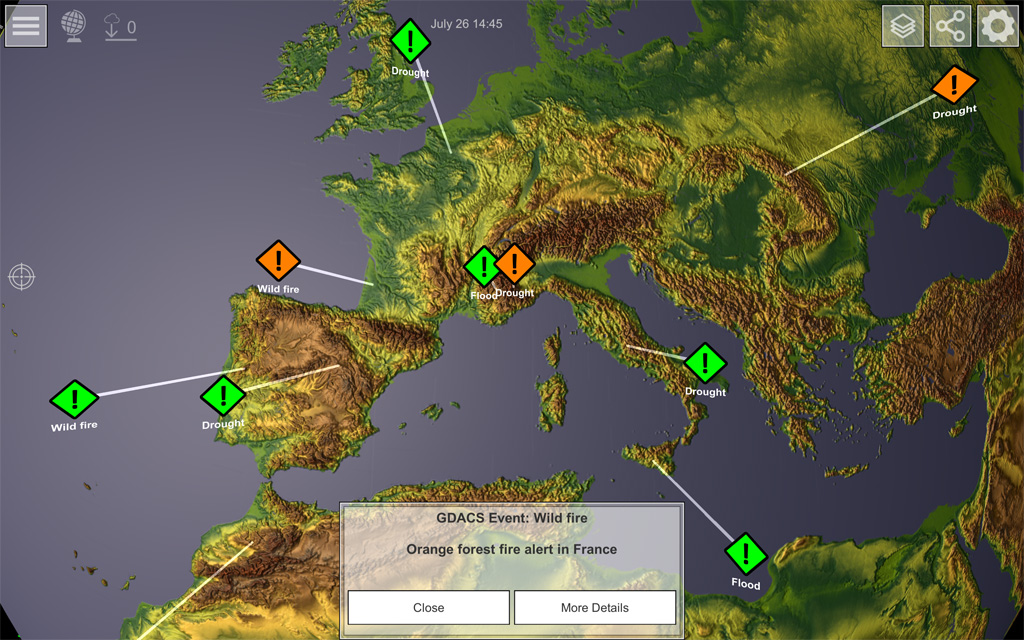
Global overlays of 3D detail maps
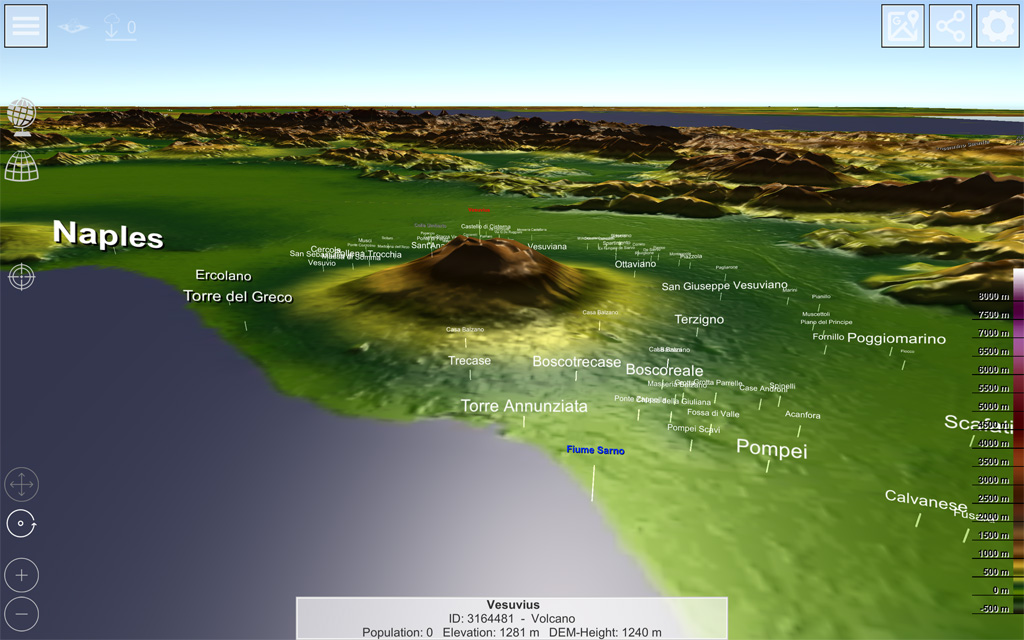
Almost the entire surface of the earth (above sea level) is available as a 3D model. If you switch on the markers for the regional maps in the options, you will find the available map sections distributed across the globe.
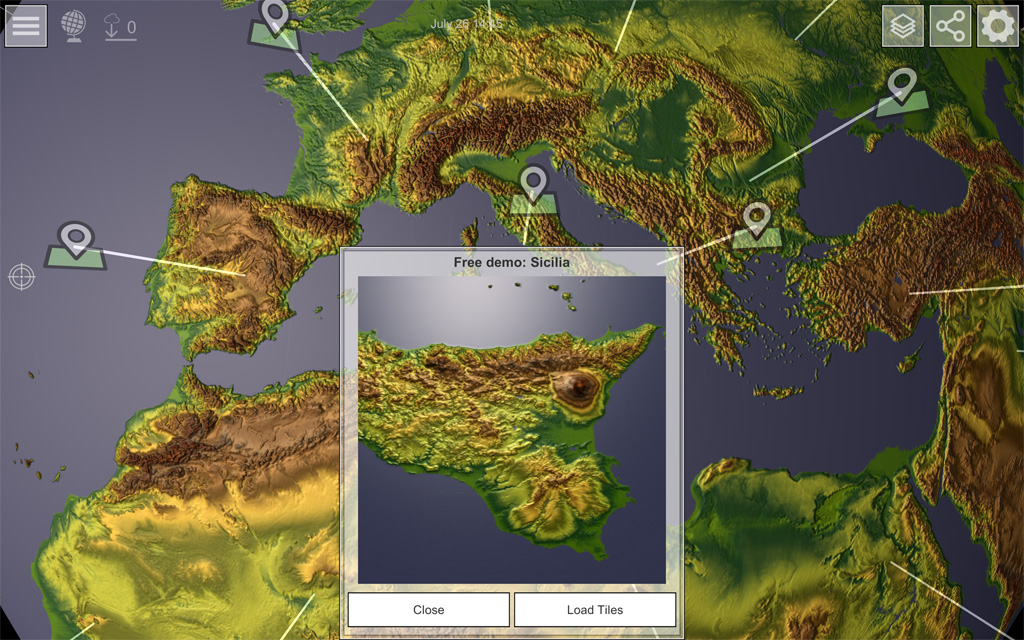
Regional Maps
Overview of the regional map
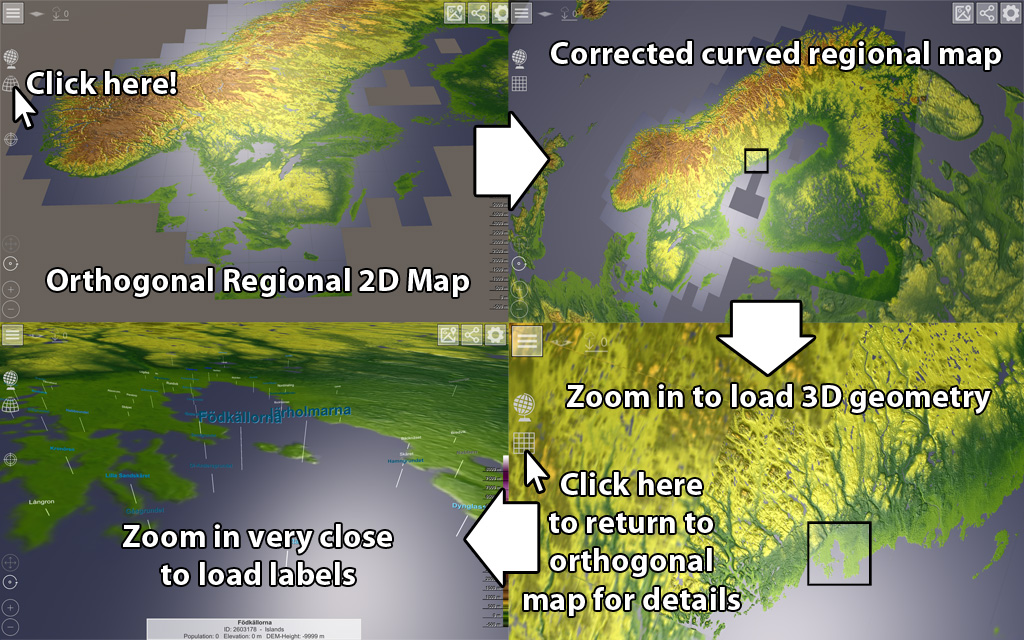
Most maps show a very large area. For technical reasons, the 3D maps have been divided into many individual tiles. Since it makes no sense to load all 3D data at once, you can use the camera position to select the areas that you want to take a closer look at by zooming in on a specific position. If you are close enough to the tile, the 3D data will start downloading automatically. At the top left of the screen you can see from the counter how many tiles still have to be loaded at the moment. If you have a slow internet connection, you need to be patient for the download to finish.
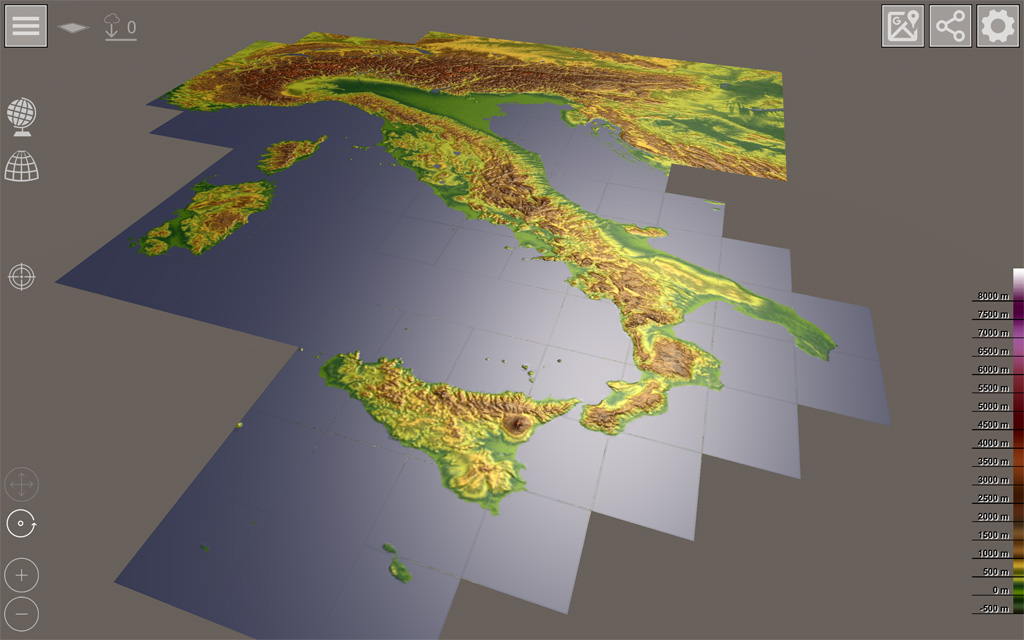
3D model in detail
Once the data has been downloaded, the 3D model is placed at the location of the 2D tile. In the options you can set the direction of the light, the highlight and the strength of the surface structure. Zoom in very closely to see all of the localities and topographical features available in geonames.org data.
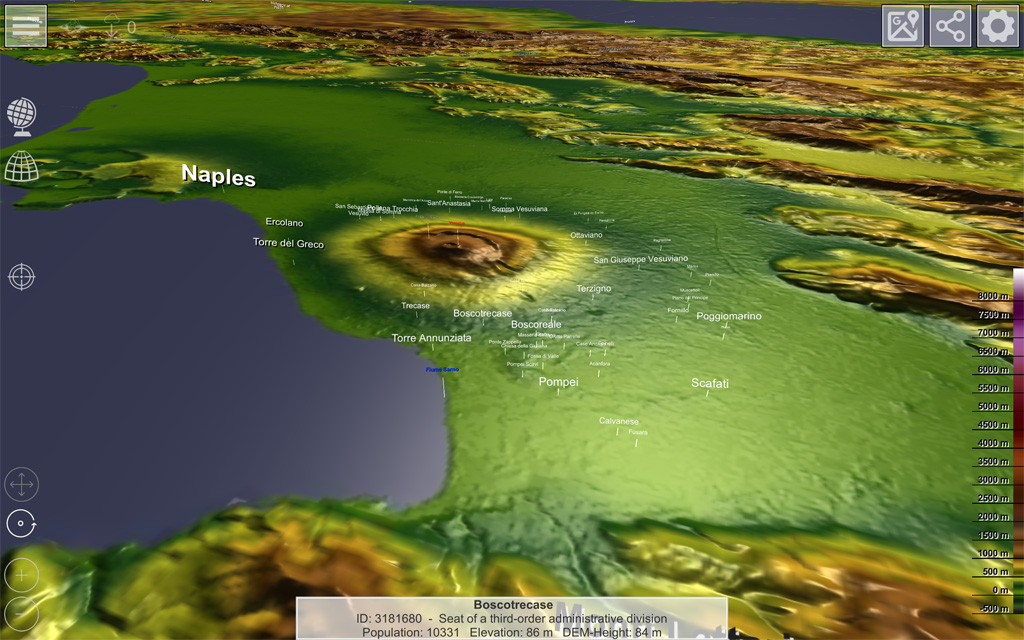
Height multiplier
In many areas the earth is quite flat, so the mountains that seem quite high to us appear quite flat in the view. But this is not a problem at all, because we can simply stretch the 3D model upwards. There are various settings in the options so that even flat areas appear a little more plastic.
Application of orthogonal and rectified map
The 3D tiles are all orthogonal - i.e. aligned with the longitude and latitude. Since the earth is known to be a sphere, the orthogonal tiles must be compressed and stretched accordingly so that they show the actual proportions. The graphic below shows how you can switch maps.
Facts and figures
The elevation model raw data was recorded between March 1, 2000 and November 30, 2013, from the Advanced Spaceborn Thermal Emission and Reflection Radiometer (ASTER) instrument of the NASA Terra probe launched in 1999. The raw data cover almost the entire globe (83 ° of the north and 83 ° of the southern hemisphere) and have been error corrected.
The ASTER3 elevation model consists of 22,912 tiles, each with 3,601 x 3,601 data points. All tiles are available in the App. For each tile a color texture (216 GB) and a normal texture (284 GB) were created. Also, for each tile, a 3D model was created in multiple resolutions from the elevation data (312 GB). Thus, we processed a total of 812 GB of data for the ASTER3 representation in the app.
So that these large amounts of data can somehow reach a smartphone, the resolution of the color texture has been reduced to 512 x 512 pixels and the normal texture to 1024 x 1024 pixels. Thus, we currently come to a "compatible" compressed data volume of 33.0 GB for all available 22,912 tiles - about 1.77 MB per tile. For offline use of the app, all downloaded Tile data is stored on the device. If many Tiles have been downloaded, there will be a correspondingly space occupation for the App. After the 2024 map update including OpenStreetMap data, we have now reached 105 GB of data...
Data representation
On the map surface, all major cities are displayed with a marker. In the options you can determine from population which cities should be displayed. The cities can also be completely hidden.
Present your own data
The application is designed so that you can even set markers on the planet if necessary. There are two methods for doing this: On the one hand, it is possible to enter a corresponding position (longitude / latitude) and corresponding texts via a text field. There are currently four different markers available. An example shows the existing markers and the syntax for text input.
Alternatively, reading a text file directly from the Internet is possible. For this, the matching URL to the text file can be entered. At the push of a button, this file is then downloaded and the markers defined there are set. When looking at the example, an example text file is also entered in the URL field. By clicking on the download button, these data are then displayed directly on the globe.
Text format for marker definition
The format for the text file must be structured so that a marker is defined in each line:
Longitude; Latitude; Text1; Text2; Text3; MarkerTyp
The first two values are the GPS coordinates for latitude and longitude. Then followed by three text variables, which can be displayed in the marker. At the end the marker type is needed.
Example:
12.443353; 48.245842; Ampfing ; ; ; TYPE_SIGNHIGH
10.332542; 48.851161; Bopfingen; ; ; TYPE_CITY
Marker-Types
- TYPE_CITY: red dot on the map with only one line of text
- TYPE_SIGN: Text area with 3 lines, hovering just above the marker
- TYPE_SIGNHIGH: Text area with 3 lines at a higher altitude
- TYPE_SIGNSAT: Text area with 3 lines at a very high altitude
Feedback
If you have any questions about the application or ideas for further development, just write an e-mail to

